Analyse results
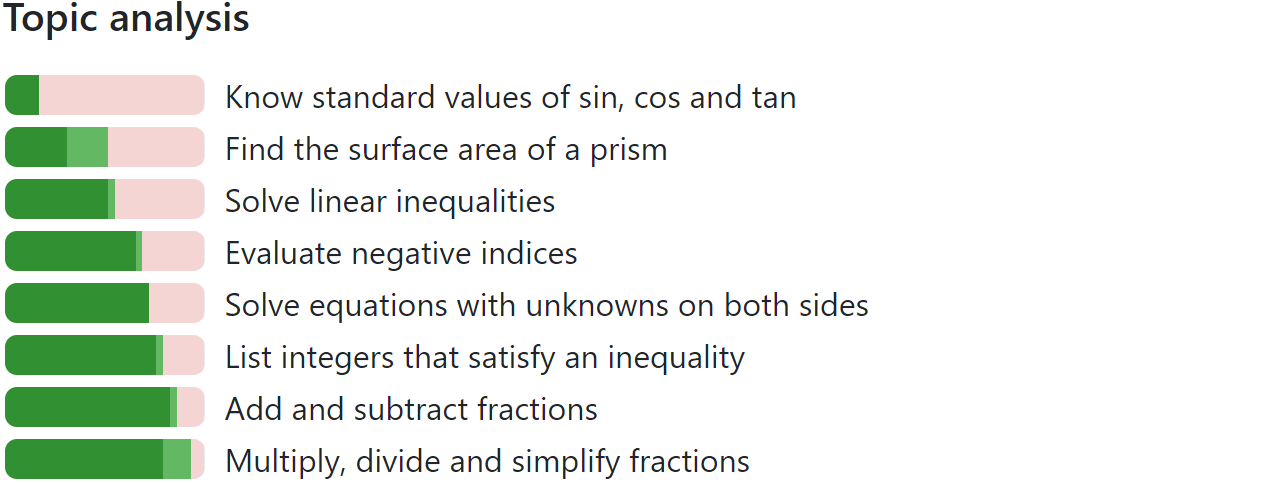
When you have finished marking, MiniTest will show you bar charts of how well students performed in each topic. You can use this to identify which concepts are secure and which ones need revisiting as a class.
You can also see how well students performed in each question.
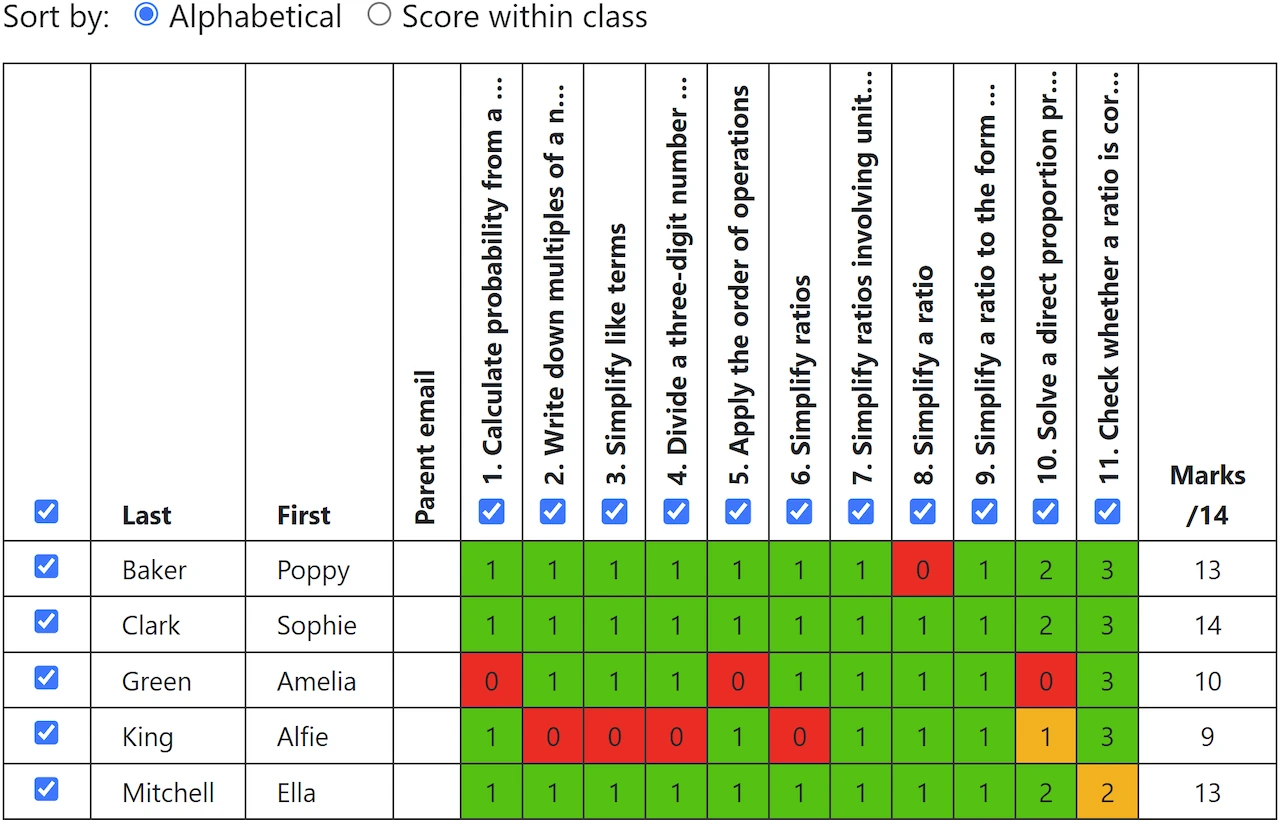
When you have used red/green marking, the light stripy green cells represent amber. These responses showed full understanding but the student made an unrelated mistake.
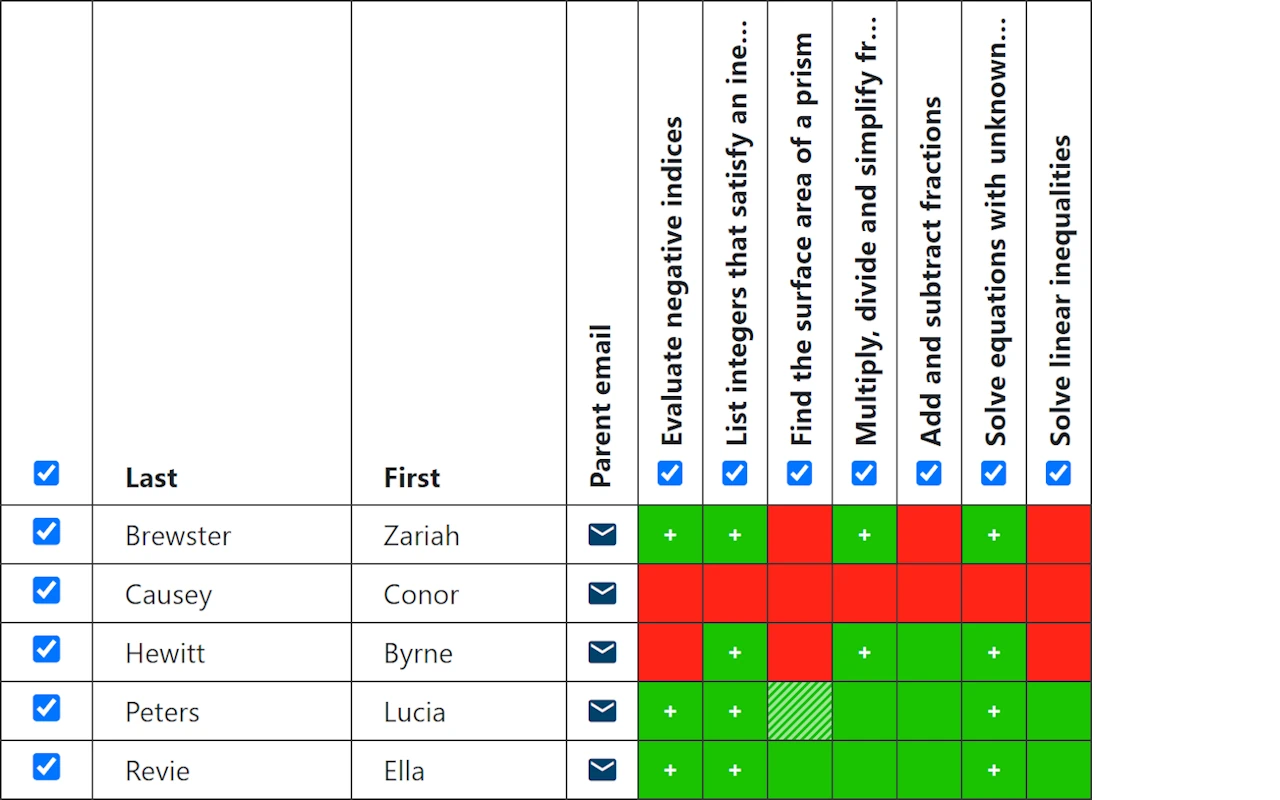
The + symbol represents a topic that was previously marked as red for that student, but has now been marked as amber or green. It is a measure of progress. Click on any cell to view the student's response for that question.
You can click the "Export to Excel" button to download a spreadsheet of results.
Print or email feedback
Using the menu at the top, you can print individual feedback for students to stick in their books. Result slips are the most budget-friendly option, and only show which questions students got right and wrong. Students should stick these in their books alongside their original work. There are also options to print more detailed feedback.

You can also email feedback to students and parents.